Tabular Editor 3 Preferences
Tabular data model development processes and workflows differ greatly from organization to organization. To ensure that the tool can fit into as many of these workflows as possible, Tabular Editor 3 is highly customizable - not just in terms of the user interface's look and feel, but also on more advanced topics such as web proxies, updates and feedback, row limits, timeouts, schema compare preferences, etc.
This article describes the Tabular Editor 3 Preferences dialogs and the settings that you can control through it.
To access the preferences dialog, go to Tools > Preferences.
Note
All Tabular Editor preferences are stored for each Windows user profile, in the %localappdata%\TabularEditor3 folder. It is possible to migrate your settings to another machine by simply copying the contents of this folder.
Tabular Editor > Features

Power BI
- Allow unsupported editing: This option is only relevant when Tabular Editor 3 is used as an external tool for Power BI Desktop. When checked, all TOM data modeling properties are available for editing when connected to an instance of Power BI Desktop. It's generally recommended to leave this unchecked, to make sure that you do not accidentally make changes to your Power BI file, that are not supported by Power BI Desktop.
Metadata Synchronization
- Warn when local metadata is out-of-sync with deployed model: When checked, an information bar is displayed inside Tabular Editor, whenever you have made local changes to the model that have not yet been saved to Analysis Services. For example, if you're wondering why a DAX query or a Pivot Grid does not produce the expected result, this could be due to a measure expression being changed in Tabular Editor without saving the change to Analysis Services. The bar disappears when you hit save (Ctrl+S). Uncheck this if you get tired of seeing the information bar.
- Track external model changes: Just like Power BI Desktop can detect when an external tool makes a change to the data model, so too can Tabular Editor. In other words, when this is checked, and another user or application makes a change to the model on a local instance of Analysis Services, Tabular Editor will receive a notification.
- Refresh local Tabular Object Model metadata automatically: Check this if you want the notification from above to actually trigger a refresh of the metadata inside Tabular Editor.
Best Practice Analyzer
- Scan for Best Practice violations in the background If unchecked, you will have to explicitly run a Best Practice Analysis from inside the Best Practice Analyzer tool window, to view if there are any violations. If checked, the scan happens continuously on a background thread whenever changes are made. For very large models, or models with very complex Best Practice rules, this may cause issues.
Tabular Editor > Updates and Feedback

- Check for updates on start-up: Pretty self-explanatory. Update notifications will not be sent during the public preview period, and the "Check for updates" button below also does not work at the moment.
- Help improve Tabular Editor by collecting anonymous usage data: Data does not contain any personally identifiable information, nor any information about the structure or content of your data models. If you would still like to opt out of telemetry, uncheck this.
- Send error reports: In cases of crashes, Tabular Editor displays an option for sending a crash report when this is checked. Crash reports are very helpful when debugging, so please leave this checked if you don't mind!
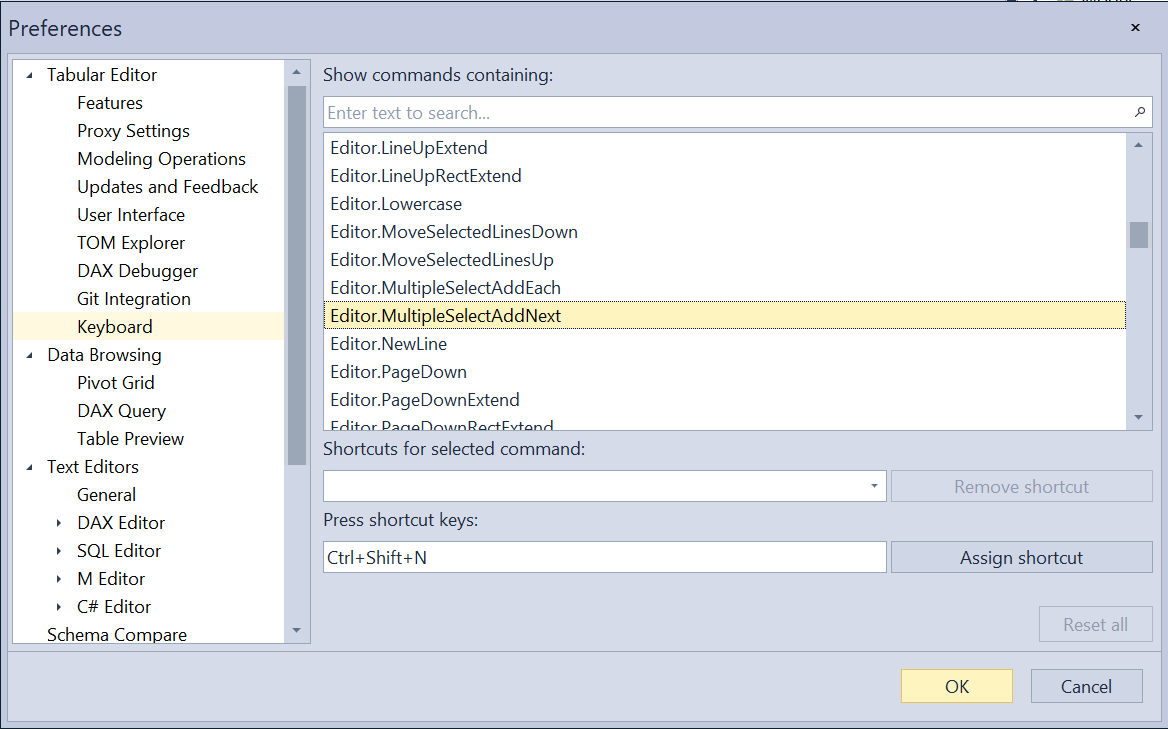
Tabular Editor > Keyboard

Data Browsing > Pivot Grid / DAX Query

More configuration options will certainly follow at some point, but this setting allows you to indicate whether new Pivot Grids or DAX Query windows will automatically be refreshed, by default, when model changes are saved to Analysis Services. You can change this behavior on a per-window basis by toggling the "Auto-execute" button as seen on the screenshot below:

This feature is super-useful when debugging a measure for example: Update the measure expression in one window, while having a Pivot Grid or a DAX query that uses that measure open in another window. Whenever you hit CTRL+S, the Pivot Grids or DAX Queries are automatically refreshed to immediately show the impact of the change you made.
DAX Editor > General

Now we're starting to get to the good stuff! This page provides a number of settings for general configuration of the DAX editor. Make sure you try out the "Code folding" feature!
- DAX function documentation: Use this setting to specify which URL to launch in the default web browser, whenever you hit F12 while the cursor is on a DAX function. I recommend using https://dax.guide but some people tend to like Microsoft's official documentation (which is available in the drop down).
DAX Editor > Auto Formatting

As can be seen from the screenshot above, the new DAX Editor is very powerful and helps you produce beautiful, readable DAX code, as you type. Feel free to experiment with these settings to figure out what editor behavior works best for you, and don't forget to provide feedback if something does not work as you expect, or if you have any ideas for additional improvements.
DAX Editor > Code Assist

On this page, you can configure the two most important Code Assist features, namely calltips (aka. "parameter info") and auto-complete. The settings mostly control under what circumstances the calltips and auto-complete box appears on the screen. However, for the auto-complete, there are a number of features for controlling which items are suggested, whether table names should always be quoted, incremental search, etc.