Adding measures and other calculated objects
- ✔ Desktop Edition
- ✔ Business Edition
- ✔ Enterprise Edition
Ever since Tabular Editor 2.x got released in early 2017, the ability to quickly modify DAX expressions across measures has always been the most popular feature of the tool. Combined with back and forward navigation, copy/paste operations, DAX dependency visualisation and undo/redo support, the tool has always been the preferred option for anyone working with large and complex data models, where the ability to quickly make multiple smaller changes is crucial.
The only complaint in this regard, by users of Tabular Editor 2.x, was the lack of DAX code assist features (sometimes called "IntelliSense"). Especially when you are not a 100% proficient with DAX (and very few people are!), having the DAX code editor assist you in remembering syntax, function parameters, etc. is incredibly helpful.
This has all been addressed with the new DAX code editor used by Tabular Editor 3.

The remainder of this article describes how to create measures and other calculated objects, and how to modify the DAX expressions on these objects. To learn more about the many features of the DAX code editor, see DAX Editor.
Adding measures
Once you have imported some tables to your model and created relationships between them, it is time to add some explicit measures containing your business logic.
Tip
Technically, you are not required to add explicit measures to your model before visualizing data in a Power BI report. However, it is a best practice to always do so, as MDX-based client tools (such as Excel and Tabular Editor 3's Pivot Grid) requires explicit measures. In addition, Calculation Groups only apply to explicit measures.
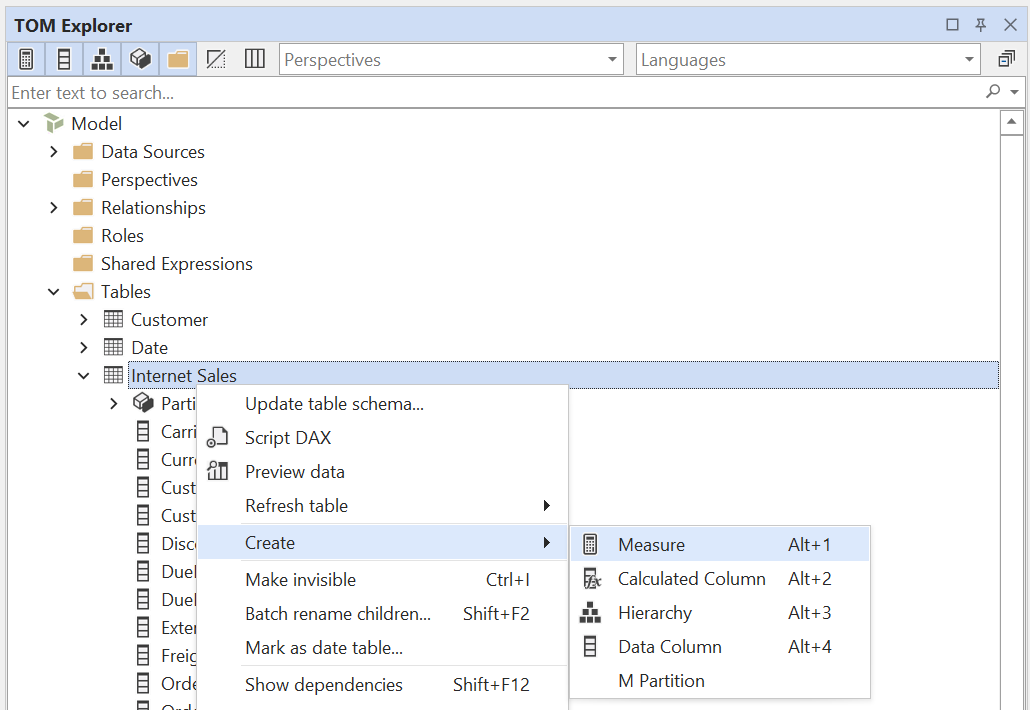
To add a new measure using Tabular Editor, right-click on the table in which you want to add the measure, then choose Create > Measure (ALT+1).

When a new measure is added, the name of that measure will be editable. Hit ENTER when you have provided a name for the measure. You can always edit the name later in the Properties view or by pressing F2 while the measure is selected in the TOM Explorer.
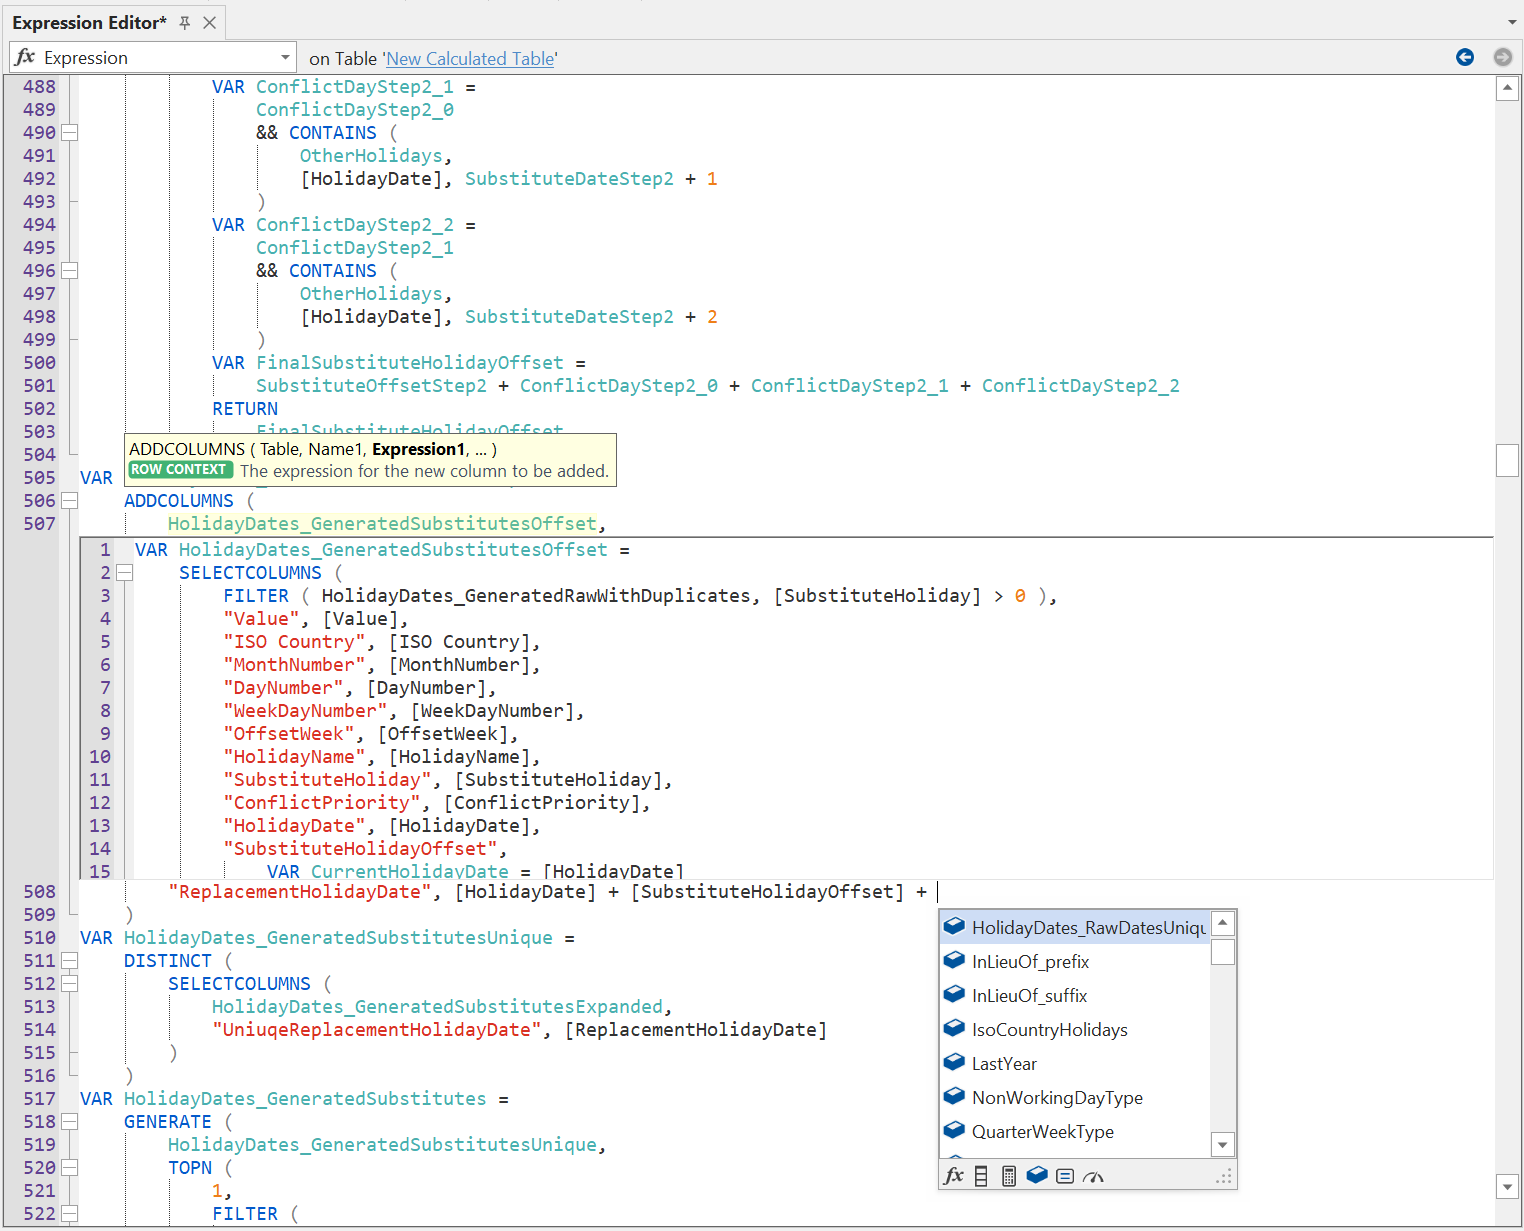
The Expression Editor view is used to provide the DAX expression for the measure. As you enter the code, notice how the DAX editor provides code suggestions and even underlines syntax or semantic errors.

The dropdown box at the top left corner of the Expression Editor is used to switch between different DAX properties of the currently selected object. For example, in newer versions of Analysis Services, measures have an Expression property as well as a Detail Rows Expression. Other types of objects can have different properties that contain DAX code. For example, KPIs have three different DAX properties. To add a KPI in Tabular Editor, right-click on a measure and choose Create > KPI.

If you want your measure to be hidden, simply right-click and choose the Make invisible (CTRL+I) option. Likewise, you can unhide a measure by choosing the Make visible (CTRL+U) option.
Other measure properties
In addition to the Name, Expression and Hidden properties, you can use the Properties view to review and edit the value of all properties of the currently selected object(s) in the TOM Explorer. For measures, this is where you can set the Format String, for example. For more information, see Properties view.
Adding calculated columns
To add a calculated column, right-click on the table on which you want to add the column, and choose Create > Calculated Column (ALT+2). Give the column a name and edit its DAX expression using the Expression Editor, similar to how we did for measures above.
Important
This option is not available by default when connected to a Power BI Desktop model. This is because of the limitations of Power BI Desktop support for external tools. Click the link to learn more.
Note
When the DAX expression of a calculated column has been changed, the table in which the column resides has to be refreshed before the column can be used in a report. See Refreshing, previewing and querying data for more information.
Adding calculated tables
To add a calculated table, right-click on the model or on the "Tables" folder, and choose Create > Calculated Table (ALT+6). Give the table a name and edit its DAX expression using the Expression Editor, similar to how we did for measures above. Notice that the columns on the table changes automatically, when you make a change to the DAX expression. This can cause cascading effects, if other DAX expressions reference the table, or if columns are used in a hierarchy.
Important
This option is not available by default when connected to a Power BI Desktop model. This is because of the limitations of Power BI Desktop support for external tools. Click the link to learn more.
Note
When the DAX expression of a calculated table has been changed, the table has to be refreshed before it can be used in a report. See Refreshing, previewing and querying data for more information.
Adding calculation groups
To add a calculation group, right-click on the model or on the "Tables" folder, and choose Create > Calculation Group (ALT+7). Give the Calculation Group a name. Also consider a different name for the default Name column.
Important
This option is only available on models at compatibility level 1500 or higher.
To add calculation items, right-click on the newly created calculation group and choose Create > Calculation Item. Give the Calculation Item a name and edit its DAX expression using the Expression Editor similar to how we did for measures above.
You can arrange the display order of Calculation Items by dragging them around in the TOM Explorer, or by setting the Ordinal property within the Properties view.
Note
When Calculation Items are added, renamed or removed from a Calculation Group, the Calculation Group has to be refreshed before it can be used in a report. See Refreshing, previewing and querying data for more information.
Common modeling operations
Copy / paste
All objects in the TOM Explorer can be copied and pasted with Tabular Editor. You can even copy and paste between different instances of Tabular Editor, and even between Tabular Editor 2.x and Tabular Editor 3. You can use the familiar keyboard shortcuts:
- Edit > Copy (CTRL+C)
- Edit > Cut (CTRL+X)
- Edit > Paste (CTRL+V)
Tip
If you want to replace one table with another, retaining all existing relationships to/from that table, copy a table to the clipboard, then select the table you wish to replace in the TOM Explorer and paste. You will be prompted whether you want to replace the selected table with the one in the clipboard.
Undo / redo
Whenever a change is made to an object or property in Tabular Editor, the complete history of changes is tracked, allowing you to undo every change made. You can use the familiar keyboard shortcuts:
- Edit > Undo (CTRL+Z)
- Edit > Redo (CTRL+Y)
Note
All text editors in Tabular Editor 3 have their own undo/redo history, so if the cursor is currently within a text editor, the keyboard shortcuts will undo/redo the typing within that editor. You can use the options in the Edit menu to perform an undo/redo at the model level, or deactivate the current text editor by clicking on another element in the user interface (such as the TOM Explorer).
Navigation
While the cursor is over an object reference in the DAX editor, right-click and choose Go to definition (F12) to quickly jump to that object. Of course, you can also navigate between objects using the TOM Explorer.
You can use the arrow buttons in the top right corner of the Expression Editor to jump quickly back and forth between objects visited.
DAX Dependencies
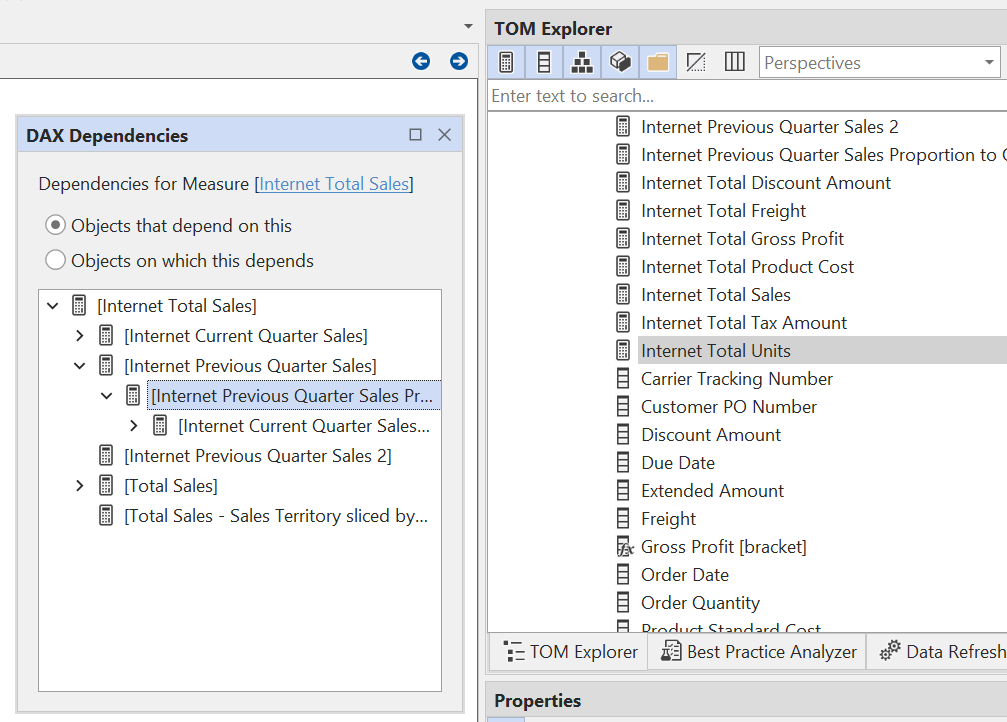
To view DAX dependencies between objects, select an object in the TOM Explorer, then right-click and choose Show dependencies (SHIFT+F12). This will open a window that displays the dependencies (in both directions) of the selected object. Double-click on an object in this window to quickly navigate to that object.

Display folders
Once your model starts to gain a considerable number of measures, a good practice is to organize them using Display Folders. In Tabular Editor, to create a Display Folder, either edit the Display Folder property through the Properties view, or alternatively, right-click on the measure(s), and select the Create > Display Folder option.
You can also cut/copy/paste or drag and drop objects between display folders.